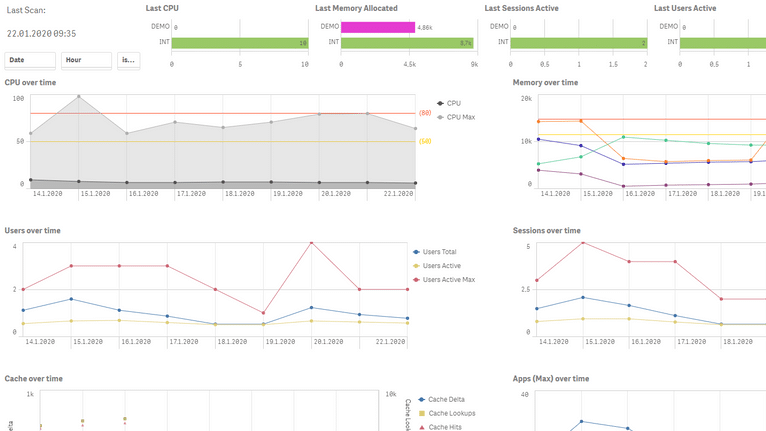
Our customer recently asked us to support 98% availability of their Qlik Sense production site (i.e. only 7.31 downtime days per year), so we developed a Qlik Sense app, that reads and stores a snapshot of engine/health check JSON data and shows it in a few visuals. It reloads in a few seconds and thus can serve as a Qlik site monitoring tool.
In case you are wondering why we don’t use a specialized monitoring tool, the answers are:
- No extra costs for the customer
- They already have the best Data Integration and Data Analytics tool, which is completely transparent, so it does not make sense to invest their time and energy into some “black-box”
- They decide on further development, what they need to add, what they need to see = they are in control
If you have a similar challenge then check a more detailed description HERE and request it from our Customer Operations Group.
Enjoy 🙂
Find my other blogs HERE.


